On the Web Portal’s “Energy Economy” page, you get a detailed overview of the economic aspect of your setup, as well as your consumption and production on a selected date or within a given time period.
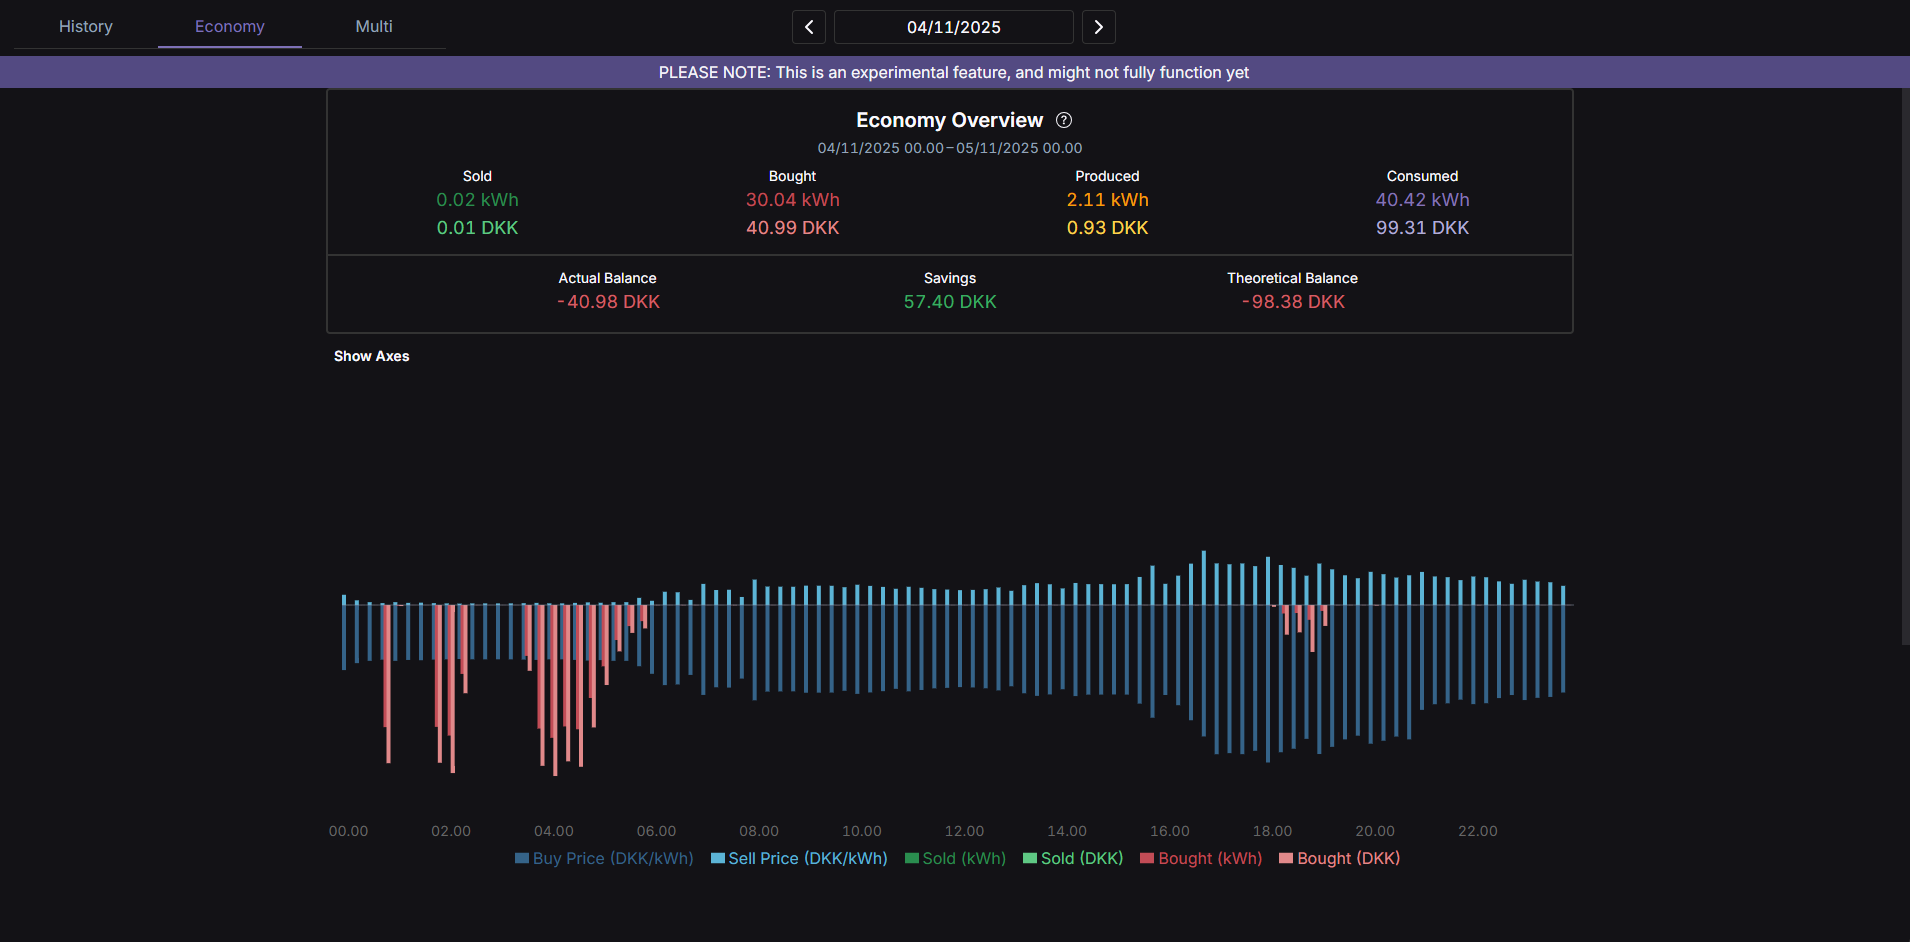
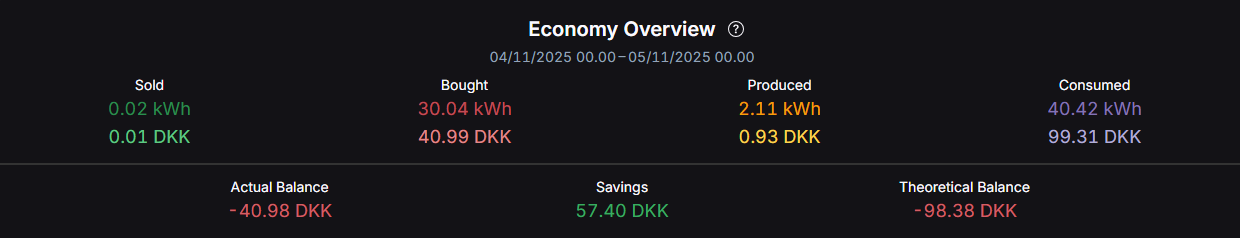
¶ Economy Overview
Here, you get a summary of your energy data in the given period, but from an economic perspective. It is divided into sold, bought, produced and consumed.
-
Sold: The number of kilowatt-hours sold and the total income.
-
Purchased: The number of kilowatt-hours purchased and the total expense.
-
Produced: The number of kilowatt-hours produced and what you would have earned from selling the produced energy to the grid at the point in time, when it was produced.
-
Consumed: The number of kilowatt-hours consumed and what you would have paid if you bought energy from the grid at the point in time, when it was consumed.
-
Actual Balance: The actual balance for the selected time period (sold - bought).
-
Theoretical Balance: What your balance would have been for the selected time period, if you had sold your produced energy right away and had bought straight from the grid when consuming power (produced - consumed).
-
Savings: What you have theoretically saved by producing and storing energy, and optimizing when you buy and sell (actual balance - theoretical balance). If this number is positive, you are doing well!
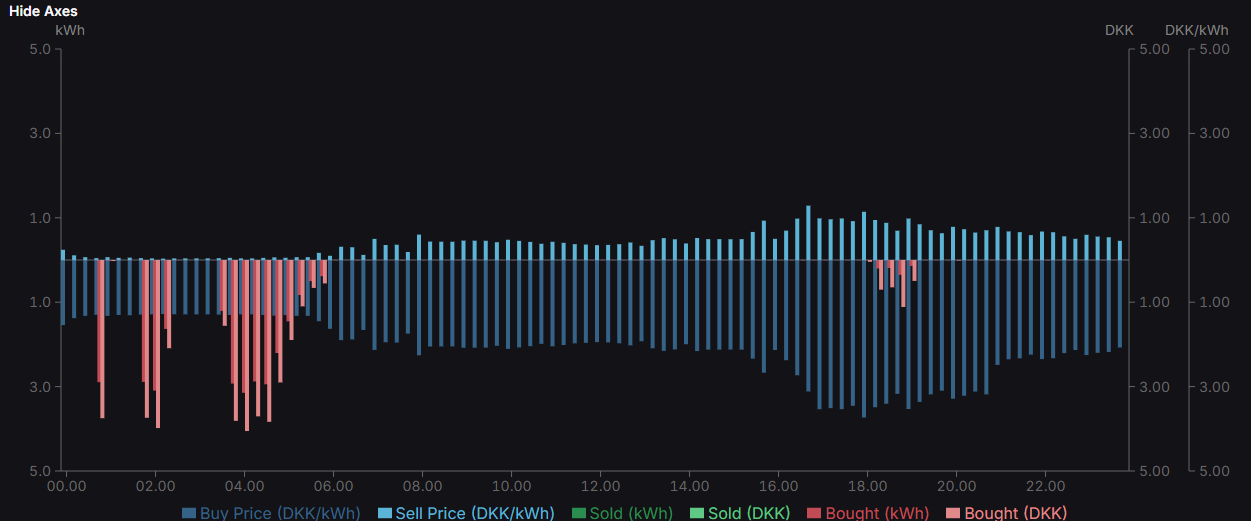
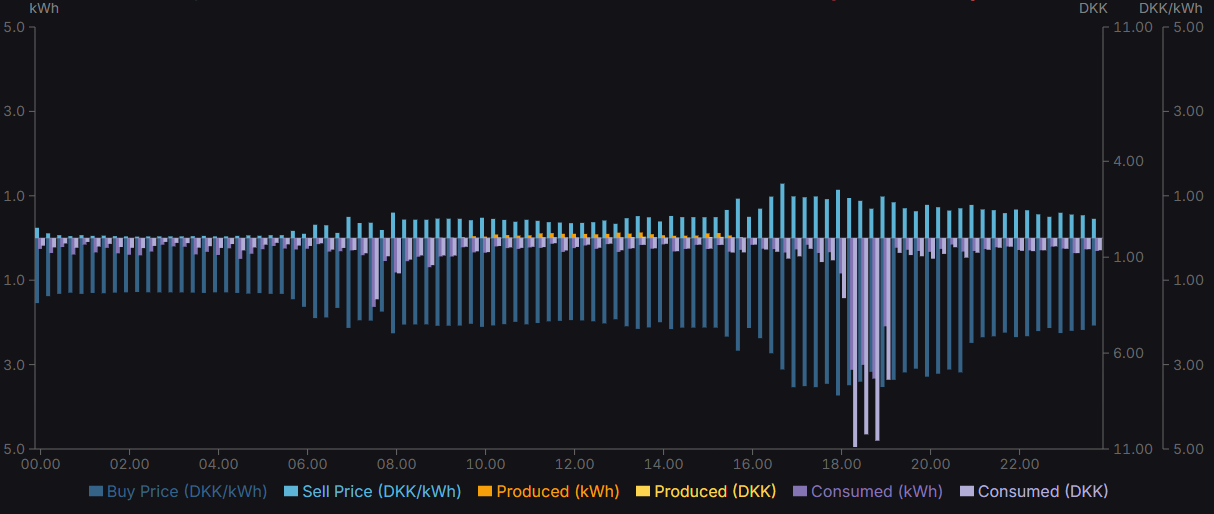
¶ Charts
If you have chosen to view data for a single day, you can also view your data in 15-minute slots in the two charts below the overview.
The energy prices for the given day is also shown, so you can see, for example, whether you have bought and sold at the right times.